


The Edinburgh Decentralization Index (EDI) was first announced in November 2022 during the IO Scotfest. A joint effort between the University of Edinburgh and Input Output Global to develop a framework to research, define and measure decentralization. This effort to define decentralization in an academic setting stems from the fact that government regulation seems to be focused on the notion that cryptocurrency founders have an unfair market position on their projects. Therefore, the crypto they founded is not decentralized and they can be held accountable to regulation by enforcement of government regulatory agencies.
Academic Approach
The rigorous academic approach taken with the development of the Edinburgh Decentralization Index follows the same methodology that IOG has taken with the development of Cardano, in conjunction with important universities like Athens, Tokyo and Edinburgh. In February 2024 the paper titled SoK: A Stratified Approach to Blockchain Decentralization was presented in the Financial Cryptography 2024 conference. This paper was authored by Christina Ovezik, Dimitris Karakostas and Aggelos Kiayias from the University of Edinburgh Blockchain Technology Laboratory. Since Aggelos is also the Chief Scientist at IOG, a lot of people from other crypto projects were skeptical that there would be a positive bias towards Cardano.
At the time of writing this article, the EDI has published the framework for assessing decentralization in the consensus and tokenomics layer. In the future the researchers from the laboratory will add hardware, software, network, client API, governance and geography layers as stated on the research paper.
Consensus Layer
Aggelos made a post on X/Twitter about the launch of the alpha version of Edinburgh Decentralization Index back on March 6th, 2024 alongside an official blog post on the Blockchain Technology Lab website.
The research team has stated that their goal is to include all the relevant layer-1 blockchains into the EDI framework. At the moment of writing this article, the available projects are bitcoin, bitcoin cash, cardano, dogecoin, ethereum, litecoin, zcash and tezos.
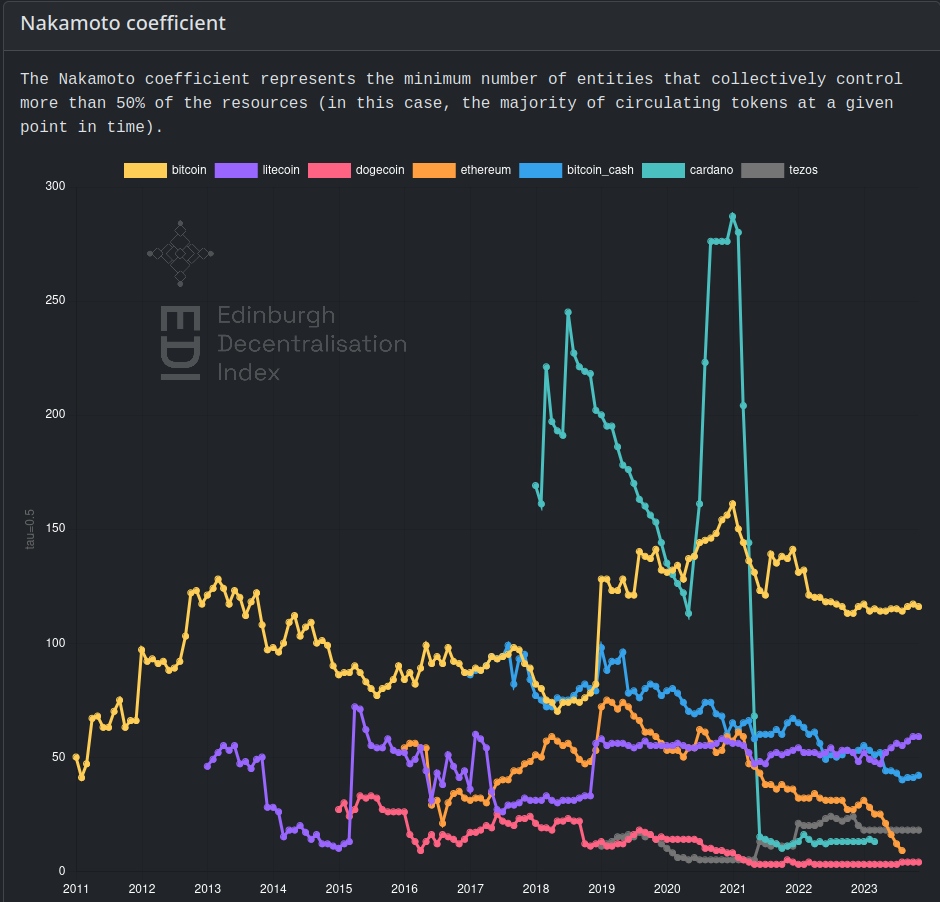
The first graph from the consensus layer is the Nakamoto coefficient. The description reads “The Nakamoto coefficient represents the minimum number of entities that collectively control more than 50% of the resources (in this case, the majority of mining / staking power).”
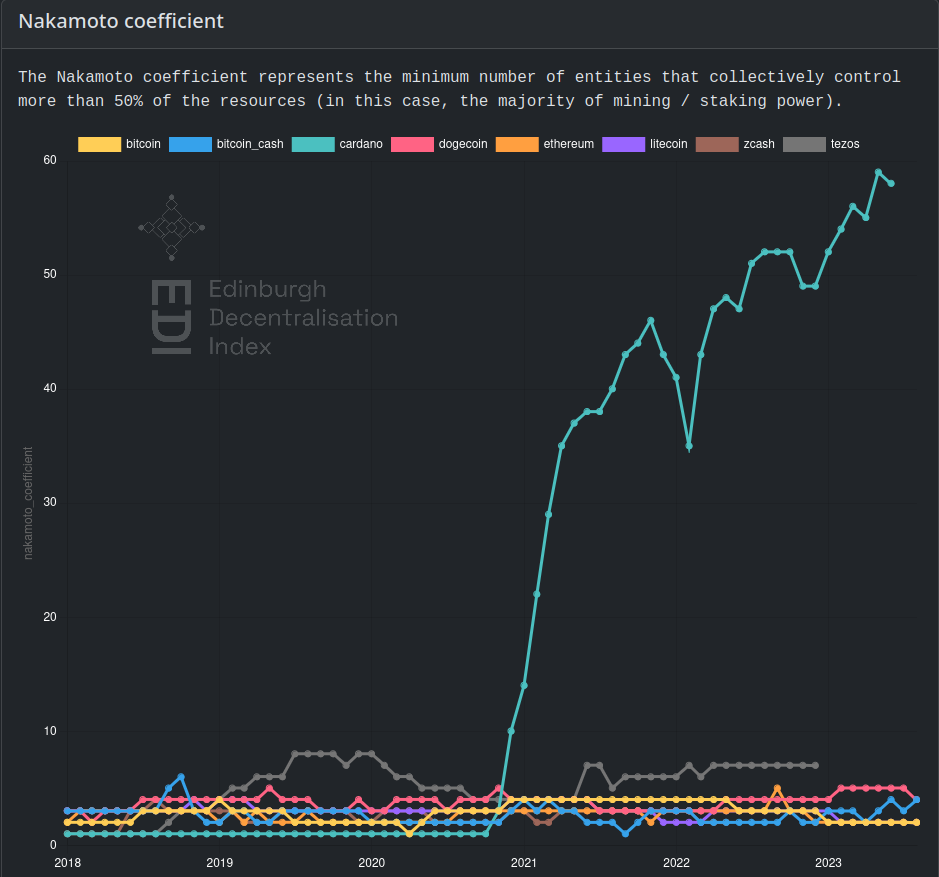
Unfortunately the data available is not up to date and different projects have different cut off dates which makes comparison between them even more challenging. What we can take from this first graph right away is that Cardano is leading in terms of consensus decentralization according to the Nakamoto coefficient. With a value of 58 by June 2023, Cardano is by far the most decentralized project in this study. However, many skeptics and haters used this huge difference to validate their assumption that EDI had a positive bias towards Cardano.
But the criticism didn’t come only from across the street, known Cardano community member @Cerkoryn took on the task to validate this data and found some shortcomings. This is because the team from Balance has been reporting the Nakamoto coefficient of Cardano on their website for some time now and there’s a big discrepancy.
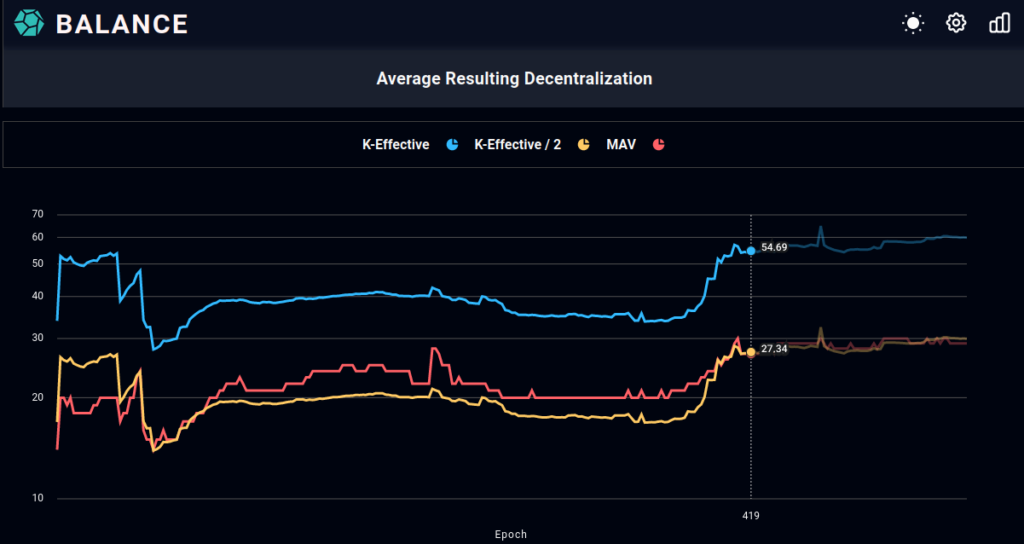
On epoch 419, which corresponds to the end of June 2023, the Minimum Attack Vector (MAV) calculated by Balance was 27.34 meaning it would take 28 entities (rounding up) to confabulate to take over the network. A far cry from the reported 58 by EDI. As stated on this tweet Cerkoryn seems to believe that the difference is due to EDI ignoring or not counting a big cluster of multipools that is Coinbase/Avengers (these are the stake pools operated by the centralized exchange Coinbase).
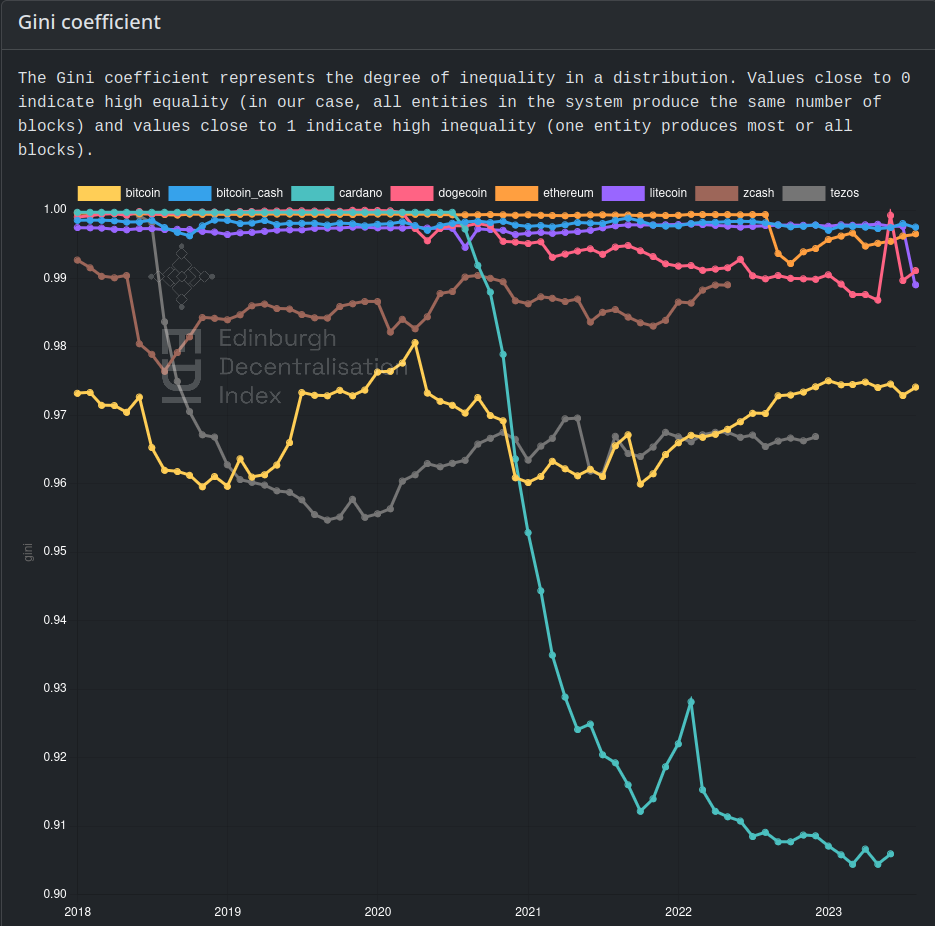
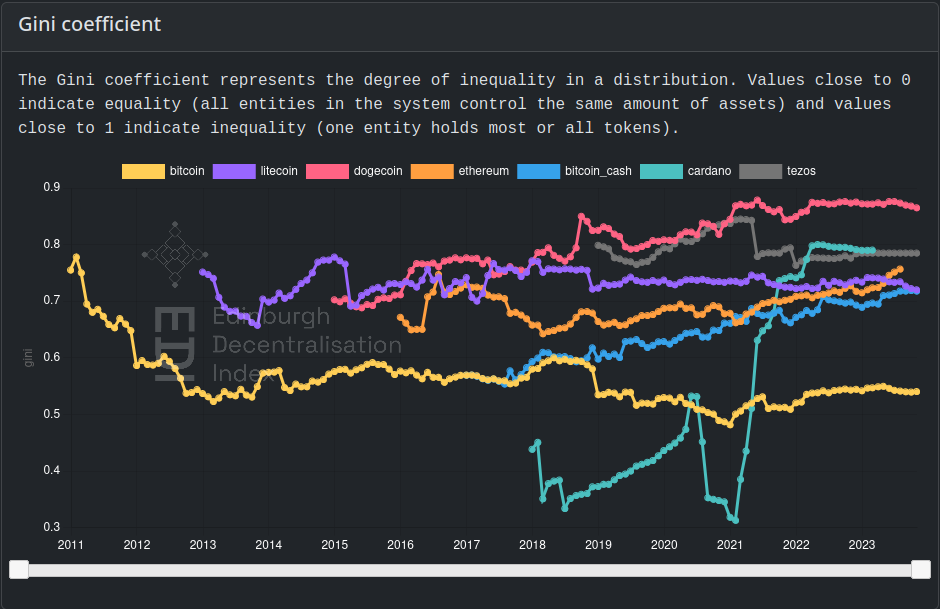
The second graph is the Gini coefficient which is more or less the inverse of the Nakamoto coefficient because this metric was created by Balaji by applying Gini and Lorenz curves to measure decentralization. The Gini coefficient is widely used in economics and sociology to measure the inequality in a distribution, more often than not wealth and resources in a society. However, here it’s important to remember that this is the inequality in a distribution of consensus not in tokenomics which is the next layer.
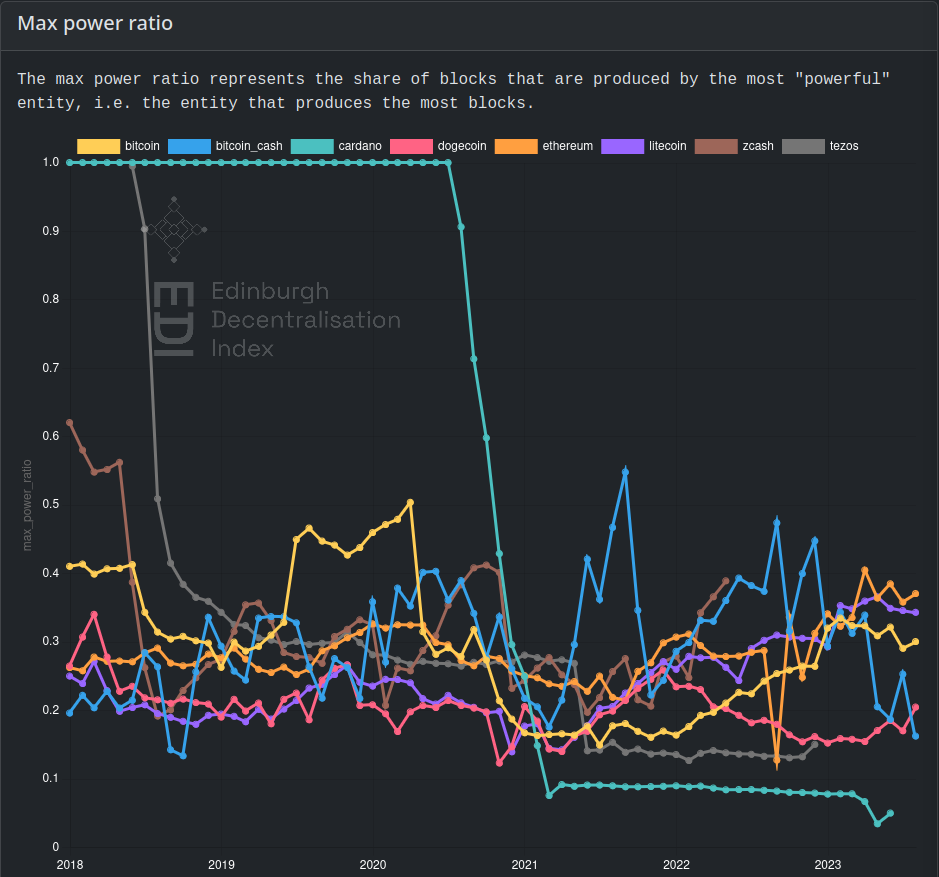
Skipping a few graphs, the next interesting one is the Max power ratio “which represents the share of blocks that are produced by the most “powerful” entity i.e. the entity that produces the most blocks”. This graph is perhaps the one that illustrates the decentralization of the Cardano consensus because we can see that in the beginning the block production was federated, only the founding entities were creating blocks. Once the Shelley hard fork came around and introduced the stake pools and blocks minted by the community we can see the sharp drop from 1 in July 2020 to 0.076 in March 2021.
Tokenomics Layer
The alpha version of the tokenomics layer was added to the Edinburgh Decentralization Index on May 2nd, 2024 almost two months after the consensus layer.
What’s the difference between the Nakamoto coefficient for consensus and tokenomics you may ask? In the case of consensus what is being measured is how much staking power does every entity possess at the time it was recorded. This means that a big multi-pool with 200M ADA delegated to them across the many stake pools they operate will mint more blocks than a single stake pool and therefore have a bigger percentage of the overall blocks minted, thus having a bigger influence on consensus. But if their delegators decided to support decentralization over short-term profits, the power that the multi-pool has over the consensus of the network would diminish.
In the case of Nakamoto coefficient for tokenomics what is being analyzed is the control over the resources, in the case of Cardano it’s $ADA, therefore it’s not counting delegated stake but the owners’ pledge, in the case of stake pools. It’s also accounting for the wallets of known entities such as exchanges, ecosystem companies and founding entities.
We can observe from the graph that in December 2020, 287 entities controlled more than 50% of the ADA in circulation. Unfortunately by May 2021 the number of entities that controlled more than 50% had dropped to only 15. The last record we have at this moment is February 2023 with a value of 13.
What is surprising, at least to me, is that Bitcoin scores the lowest in Nakamoto coefficient for consensus, due to the centralization of mining power in a few multi-millionaire companies. But scores the highest in Nakamoto coefficient for tokenomics since 116 entities controlled more than 50% of the circulating supply.
The Gini coefficient for tokenomics also paints an interesting picture. For starters Dogecoin has the least equal distribution of its token, which is not surprising, since most of the circulating supply is held by a few whale wallets. However, by February 2023 Cardano was the second one with the least equal distribution with a value of 0.79 after having the best score of 0.312 back in January 2021.
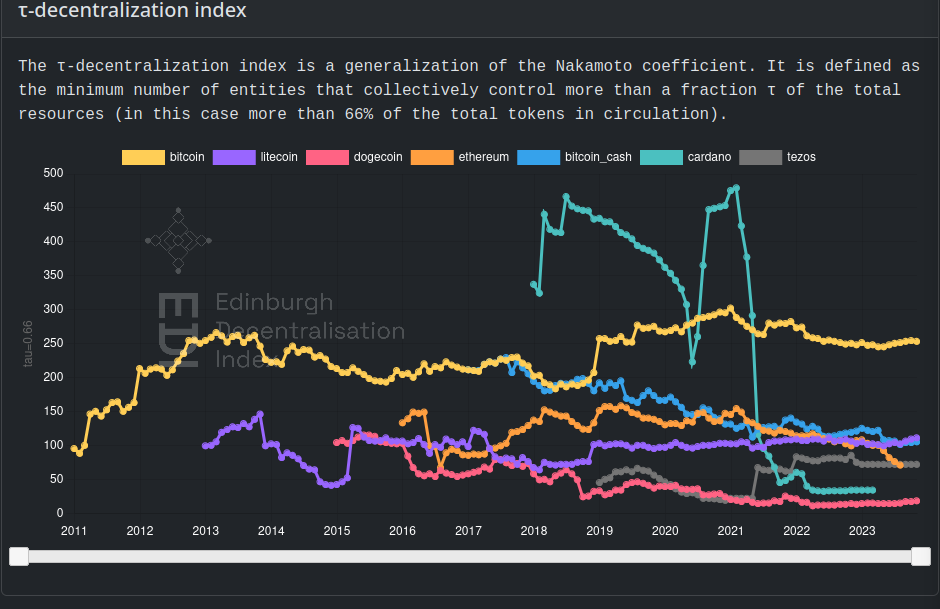
The last graph I’m going to share with you in this article is the tau-decentralization index which measures how many entities control more than 66% of the circulating supply. Very similar to the Nakamoto coefficient which measures how many entities control more than 55%. By February 2023 Cardano was also second to last with a value of 34, only surpassed by Dogecoin with 15 and in first place was Bitcoin with 248.
From what we have seen so far, it’s fair to say that Cardano is the most decentralized in terms of consensus but comes second to last in terms of tokenomics. Which is very concerning in a Proof-of-Stake blockchain where users use their ADA to vote.
Implications on CIP-1694
As of February 28, 2023, according to EDI, 13 entities controlled more than 50% of the circulating supply of ADA and 34 entities controlled more than 66%. How are we going to have any resemblance of a fair and just governance system in which 1 ADA=1 vote, if the decisions are ultimately made by a handful of insiders?
As I covered previously in my articles CIP-1694 “Temperature Check”: Vox Populi, Vox Dei? And Why Governance on Cardano Will Fail the few ballots/polls/temperature checks we have had on-chain so far have been very disappointing in terms of participation and honoring the results. When SPOs voted to have k increased to 1000 from 500 the parameter committee decided it was not in their self-interest and recommended to leave k at 500.
We can already appreciate the influence by this handful of entities controlling the governance in Project Catalyst. As X/Twitter user @jotapippo pointed out in this thread regarding the analysis of Fund10 voting results, when you segment the votes instead of looking at the aggregate result, the manipulation by the whales is apparent. So much so, that this led to IOG removing the negative vote in Fund 11 to save face.
My argument continues to be that that governance on-chain needs to be postponed until the last mile problem of decentralized identifiers (DID) has been solved. This is the only piece of tech that could solve the problem of having so much ADA concentrated in a few hands, for decision making. Nothing wrong with having a big position unless it’s used to manipulate the governance while claiming it to be a democratic system. There’s no point in rushing the last phase of the Cardano roadmap after years and years of rigorous development. Otherwise we are just ratifying a plutocracy system on-chain instead of a liquid democracy.
Conclusion
It’s still early days for the Edinburgh Decentralization Index, with only two of eight layers for measuring decentralization published. In the future the research team may come up with a weighted average of all the categories to provide one single metric to measure decentralization across all layers. At this point in time is important to understand and accept that while Cardano may be the most decentralized on consensus, in tokenomics it leaves a lot to be desired. Cardano maxis will only focus on the consensus metrics, while Cardano haters will focus on the tokenomics. Critical thinkers and sovereign individuals will take a look at the whole picture and point out what is working and what it’s not.