
CTimelines has a vision to make education within the Cardano Community as accessible as possible. The project has a user-friendly web portal at CTimelines.io, which contains curated Gitbook documentation, and aims to make learning easier for everyone. A big part of CTimelines is the Ecosystem Milestones Repository, which keeps track of Cardano’s key moments. With its comprehensive look at Cardano’s past, present, and future, CTimelines is a key resource for those seeking a deeper understanding of Cardano.

CTimelines provides a visually engaging and educational experience for the Cardano Community – which includes digital currency collectors, speculators, newbies, experienced coders, and more. The Cardano blockchain’s history is a complex puzzle to put into focus, demanding a concise yet detailed historical record. Newcomers to the blockchain space benefit from a structured narrative that improves their grasp of Cardano’s complex journey. Developers can also gain valuable insights into the platform’s evolution, inspiring new creativity and fostering collaboration.

The infographic is a great resource to spread awareness of Cardano’s technology and accomplishments, potentially growing its user base. Additionally, it may spark lively community discussions, which are a healthy occurrence in any growing ecosystem. Beyond its educational and community-driven benefits, the timeline visualization functions as a strong branding tool, highlighting Cardano’s stature as a pioneering blockchain platform, attracting potential investors, developers, and partners. The invaluable context provided by the timeline could propel Cardano’s growth and innovation even further.
Community members can interact with project information in a whole new way thanks to the new CTimelines.io web portal. Milestones, documentation, and visuals are all accessible from CTimelines.io, which acts as an information hub. With this platform, accessing information gets easier, communication gets better, and collaboration becomes more efficient. Through a user-friendly interface, CTimelines.io not only provides a consolidated learning resource, but also presents real-time updates for better decision-making.
In order to maintain credibility and transparency, each milestone is meticulously sourced, as demonstrated by the “Metrics of CTimelines Project Success” spreadsheet. This illustrates CTimelines’ commitment to empowering the Cardano community with readily accessible and insightful information.
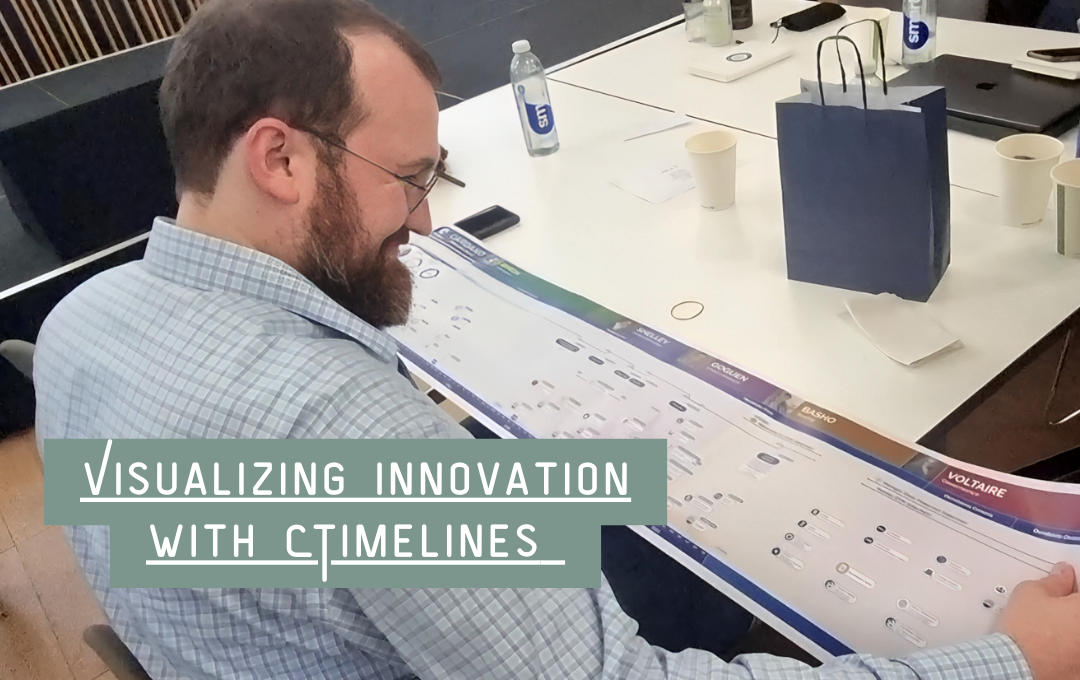
The team hopes to foster partnerships and contribute to educational initiatives by leveraging existing connections and event participation. They’ve been working on this project for about a year without any compensation, but have already come up with an initial Cardano Timeline infographic, an MVP of their web portal, and a presence at prominent Cardano events. The Project Catalyst proposal put together by the CTimelines team is part of an effort to compensate them for their time as well as turbocharge their efforts going forward.

The proposal author, Jotape, was kind enough to do an interview for this article. He provided lots of details, including the following:
“The proposal consists of four main milestones:
1. Developing a comprehensive Milestones Repository that will serve as a valuable resource for documenting the historical development of our vast ecosystem.
2. Design & publish the Cardano Timeline 2023 infographic, highlighting the major achievements and advancements in Cardano’s history.
3. Design & publish the Research Timeline 2023 infographic, focusing on the academic papers and specifications that have contributed to Cardano’s blockchain development.
4. Global Presence at the Cardano Summit 2023, distributing posters of Cardano’s history.”
Jotape
A Core Team consisting of Juan Manuel Castro Pippo, known as Jotape, Juan Franscisco Razzini, and Mauro Hernán Falcone, affectionately referred to as Mou, is spearheading this endeavor. Mauro Andreoli and Lucas Macchiavelli, the Supporting Team, boost the initiative as well. As a team, they appear poised to make significant strides, capitalizing on their skills and unwavering commitment to take the project to the next level.
The Interview
Q1. How does your project, “CTimelines,” aim to contribute to the Cardano ecosystem’s understanding and growth?
Jotape:
As Cardano has been in operation for over 5 years and has experienced significant growth, it becomes increasingly difficult for individuals to grasp the entirety of its history and the key milestones that have shaped its development. The blockchain ecosystem is vast and constantly evolving, with new advancements, updates, and achievements being made regularly. Without a consolidated and easily accessible resource, it can be challenging for individuals to gain a holistic and comprehensive understanding of Cardano’s journey. They may struggle to keep up with the numerous events, technological breakthroughs, partnerships, and community initiatives that have occurred over the years. CTimelines will design & promote Cardano Timeline Infographics, with each flavor representing history from a unique perspective to document the development of our vast ecosystem.
Q2. How did you come up with the idea to create an infographic timeline of Cardano’s history? What made you want to do it?
Jotape:
Short story, my motivation was to address a personal pain point – comprehending the intricacies of Cardano protocol’s development.
Long story… In early 2021, I embarked on my journey into the realm of blockchain. My explorations began with Bitcoin, had a brief stint with Ethereum, and eventually found my heart captured by Cardano. This affinity was largely rooted in its philosophy and core tenets: An unwavering emphasis on security and decentralization, a vibrant community driven by humanistic values, and an academic approach underpinned by rigorous peer review. From that juncture, my days became consumed with devouring insights about the Cardano development. The quest was to truly fathom its evolution, spanning development phases, consensus protocols, impactful hard forks, infused features, parameter shifts across time, the pinnacle academic papers and other relevant milestones. This journey illuminated a critical gap – while a plethora of information floated around, the context and chronology of pivotal events often remained obscured. An isolated event holds a disparate essence compared to its resonance within the tapestry of historical context. The latter provides invaluable clarity, enriching the entire comprehension. Harnessing my long-standing penchant for Excel spreadsheets, I embarked on an endeavor to consolidate the accrued knowledge into a structured repository, meticulously cataloging each fragment with corresponding sources.
Assembling Cardano’s historical puzzle became a personal mission – an avenue to forge a genuine connection with the project’s trajectory. This pursuit took on the role of a digital archaeologist, delving into the layers of the past and weaving them into a coherent narrative. During one of my interactions on Discord, aimed at enriching this repository, I encountered Alex Pestchanker, the co-founder of the vibrant LATAM Cardano community. A conversation unfolded, sparking Alex’s interest in my endeavor. Recognizing its potential, he encouraged me to explore Project Catalyst Fund 9 for a more professional approach. As the sands of time trickled, we chose not to submit an application for that funding round due to the impending deadline. Nevertheless, this pivot led us to a revelation – the discovery of Visual Cardano, a project that championed the visual representation of the ecosystem and had secured funding in the preceding Fund8. Eager to embrace this opportunity, I collaborated with a lifelong friend, Juan Razzini, a graphic designer. Armed with a treasury of pivotal Cardano milestones, we set out to craft an infographic that would not only appeal to the senses but would also facilitate understanding for the end user. The unveiling of our inaugural infographic marked a pivotal moment – confirming a universal truth. What had been my journey echoed throughout the broader ecosystem. The influx of feedback, positive sentiment, and engagement from the community reverberated, validating our chosen path.
And so it began, a project that continued evolving, a cascading array of collaborations culminating in the CTimelines project formalization.
Q3. Could you explain the importance of partnerships in promoting and disseminating your infographics?
Jotape:
A key emphasis of our F10 proposal is to transcend geographical boundaries, ensuring the widespread presence and distribution of the Cardano Timeline worldwide. Given that the Cardano Summit 2023 is the most significant event within the Cardano ecosystem, held across multiple cities worldwide, it seemed fitting to align our efforts with this event. We have established preliminary partnerships with hosts who will be organizing the Cardano Summit in the following cities: London, Oslo, Buenos Aires, San Antonio, Seoul, Vancouver, Amsterdam, and Dubai. The concrete plan involves funding posters to distribute among attendees at each respective event. To streamline costs and mitigate international shipping complexities, the logistics of printing and distributing these posters to local attendees will be handled by each individual host.
Q4. Could you share some insight into how partnerships will strengthen the foundation of the project?
Jotape:
Engaging with the community is essential for the development of our ecosystem, and this includes creating spaces for collaborations to flourish among various projects. We draw inspiration from the work accomplished by other projects, just as other projects draw inspiration from ours. From these collaborations, we have gained valuable insights and formed meaningful connections. The community is a cornerstone of Cardano, and by participating and collaborating, we all mutually benefit. If the Cardano ecosystem thrives, all its members reap the rewards.
Q5. How do you make sure your infographics effectively convey the historical development of Cardano’s ecosystem to a diverse audience?
Jotape:
When crafting an infographic, achieving a delicate equilibrium is paramount. It’s imperative to distinctly outline the data to be incorporated and the manner of its visualization. Our methodology revolves around precisely identifying the pivotal milestones within the ecosystem’s history. Our extensive experience in documenting Cardano development has endowed us with a keen ability to recognize genuinely momentous events that warrant prominence. Our objective is to ignite user curiosity, compelling them to delve into and explore events that might have previously remained unnoticed or seemingly insignificant to them. Simultaneously, we aim to enhance their understanding by providing contextual and historical information for each milestone.
Q6. The blockchain and cryptocurrency space is rapidly evolving, so how do you plan to keep the Cardano Timeline infographics current?
Jotape:
You have hit the mark with this question. One of our most significant challenges is the ever-accelerating evolution and increasing complexity of the Cardano ecosystem. This poses a substantial hurdle, not only in consolidating the historical development but also in crafting the infographics. While beyond the scope of this F10 proposal, we’re actively exploring avenues to create a Cardano Interactive Timeline.
Our future goals are as follows: Establishing a scalable and dynamic interactive system to seamlessly integrate a multitude of milestones on demand. Implementing automated extraction (scrapping) for specific types of milestones directly from various data sources. For example, this could involve automatically retrieving Cardano node versions, parameter adjustments, CIPs, academic paper releases, ADA price fluctuations, TVL statistics, and more. Creating a streamlined process for anyone to submit relevant milestones, subject to moderation, and seamlessly integrate them into the timeline. Leveraging the interactive timeline’s potential to present additional milestones details and their corresponding sources of information. Implementing a layered filtering system that allows users to customize their visualization by selecting specific categories of milestones, providing the flexibility to focus on preferred subjects.
Conclusion
There are many amazing Project Catalyst Fund10 proposals out there. It’s a shame most of us will never get the chance to read them all. If you’re interested in supporting the CTimelines team and their vision, please consider reading their Project Catalyst proposal in full and showing them some love!