


Disclaimer: this article is for educational purposes and must not be considered financial advice.
If you follow financial or economic news, you may have heard that the yield curve has been inverted for over two years now (and is quickly uninverting now). But what does this mean?
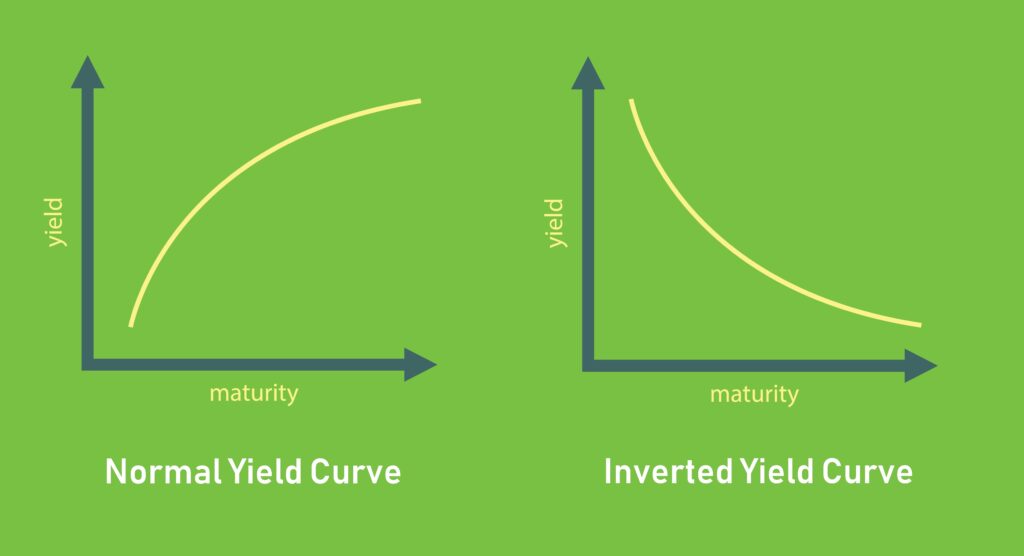
The treasury yield curve is a graphic representation of the different yields that different maturity treasury bills provide. During a healthy and robust economy, investors are willing to risk their capital to gain a premium on their return. That’s when risk assets like cryptocurrencies perform best. However, if investors are worried about the direction the economy is going they will want to put their capital on less risky assets. The US treasury bonds are considered the safest asset because the US government can always print more dollars and, at least for now, the US dollar is the main currency of international exchange.
The demand for long term treasury bonds like the 10 years goes up during uncertain times, thus driving the price up. When the price of bonds goes up, their yield goes down. The opposite happens with shorter term treasury bonds, which are considered more risky than their counterparts. Demand for them decreases, price goes down and yield goes up.
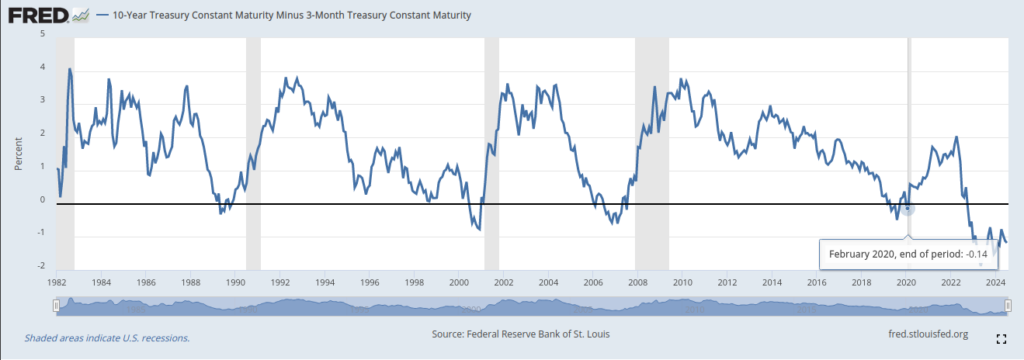
The yield curve is considered to be inverted when the shorter maturity bonds have higher yields than longer term maturity bonds. The most popular treasury bills used to compare the state of the yield curve are the 10 year and 2 year, and the 10 year and 3 months. For example the US10Y-US03MY has been inverted since October 2022 and the US10Y-US02Y has been inverted since July 2022. The longest inversion in history.
Canadian economics professor Campbell Harvey is attributed as the first person to realize that after the yield curve has been inverted for some time and it goes back to its natural state, a recession follows. His 1986 dissertation at the University of Chicago showed that the slope of the yield curve predicted real economic growth. The committee was skeptical because the yield curve inverted before the last four recessions but it was not enough data at that time. However, his theory was soon put to the test with the crash of October 1987 (S&P500 closed the month -21.76%). During the following recessions of 1990-1991 and 2001 they were preceded by an inverted yield curve, although at the time it didn’t get much attention. Most famously, the yield curve inverted again in July 2006 before the global financial crisis of 2007-2008.
More recently, from this 2019 presentation by Harvey, shows that the yield curve was inverted leading to the 2019 pandemic infused recession. Although, one could argue that even if the pandemic didn’t happen the recession was just a matter of time. Of course in this case it was accelerated by the worldwide shutdown of the economy and international trade.
The inversion of the 10 year yield in relation to shorter time frame bonds tells you that the economy is sick and a recession is coming, but it doesn’t tell you when. From this graph below we can see that the lead time to the recession can be anywhere from 5 to 22 months.
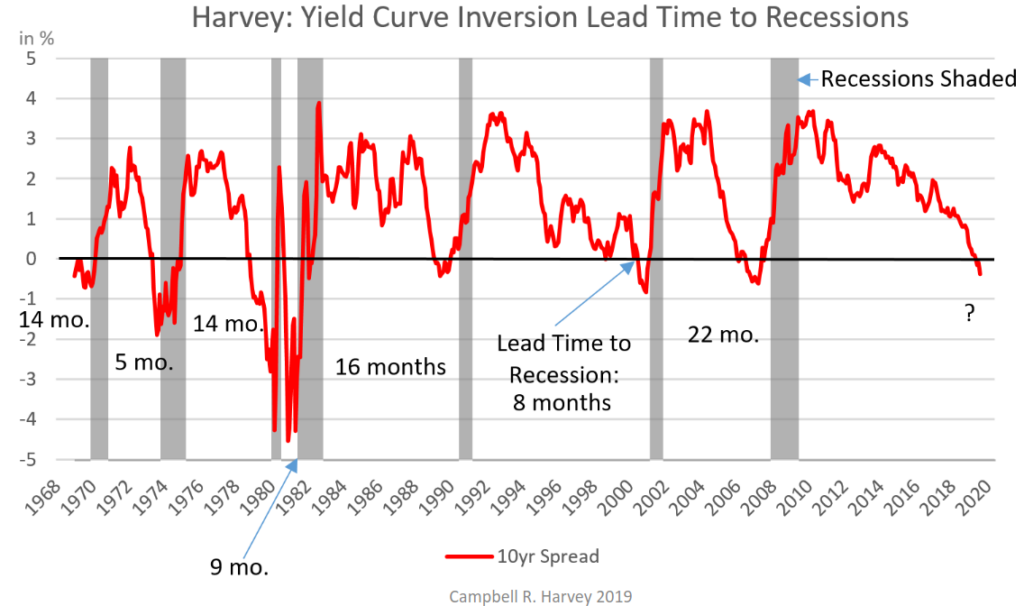
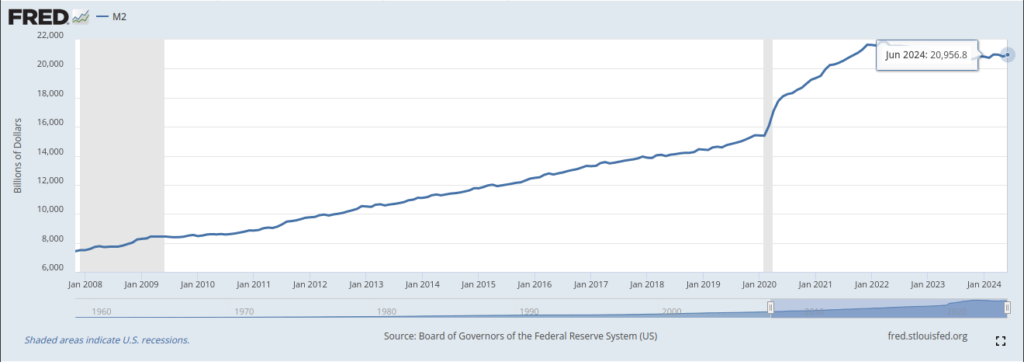
We now know that the 10Y-3M yield spread reached peak inversion in August 2019. It uninverted soon after in October 2019 to become inverted once again in February 2020 and that’s when the pandemic induced recession finally happened. But like we said before, this was an odd case. What followed was the biggest injection of liquidity into the economy by the Federal Reserve. By May 2021, 40% of all the US dollars in existence were printed in the last 12 months. This never before seen amount of quantitative easing by the FED is the reason (among others) of the spike in global inflation. As the other primary central banks of the world followed suit. Perhaps that’s the reason why the largest amount of money printed was followed by the longest inversion of the yield curve.
The FED has been trying to undo this situation by raising interest rates and decreasing their balance sheet. However, taking a look at the below chart of M2 money supply (i.e. all the cash people have on hand, plus all the money deposited in checking accounts, savings accounts, and other short-term saving vehicles such as certificates of deposit) the current amount of money in circulation is nowhere were it was back in 2019.
What about Cardano?
So what does this all mean for Cardano exactly? Well like it or not, cryptocurrencies are considered a risk asset due to their volatility. Bitcoin might be a blue chip within the industry but it is still highly volatile when compared to a blue chip stock. Therefore, Cardano being a much smaller project when compared to Bitcoin (currently 1% of its market cap) it’s similar to a penny stock.
During this phase of the economic cycle, in which the yield curve is inverted and investors flight-to-safety, riskier assets like Cardano get sold off in search of safer assets. Many people in the cryptoverse who don’t have a finance/economics background usually don’t understand why their favorite asset keeps going down if the fundamentals are stronger. I go into more detail about this topic in my article Utility, Value and Price in the Cryptoverse.
The flight-to-safety will continue by investors until they perceive that higher risk assets will outperform safer assets, like bitcoin. When will this occur? When the Federal Reserve, which is often the last central bank to act, cuts the interest rate and resumes quantitative easing i.e. printing money. They do so by buying government bonds and other securities in the open market, driving up demand.
Many people who joined the cryptoverse recently in 2021, experienced an unprecedented amount of quantitative easing that drove the cryptoassets much higher and in a shorter amount of time than expected. QE (quantitative easing) back in 2020-2021 was driven by the necessity of restarting the economy after the black swan of the pandemic. This event not only impacted crypto but the stock market as well, that’s why we saw the rise of “memestocks” which I covered in my previous article Memecoins and Memestocks: A Staple of our Time.
Cardano’s development has come a long way since the price of $ADA reached the all-time-high of ~$3.10 (depends which exchange you look at). Which was a classic event of “sell the news”, when the Alonzo hard-fork that brought us smart contracts happened. Since then developers, builders and entrepreneurs have been busy at work, putting out new tools, infrastructure, protocols and decentralized applications. Which would lead someone who is not aware of the macroeconomics side of things, to wonder how it is possible that the price has been falling for almost three years now?
That’s the beauty of investing and finding undervalued projects. Technologically speaking, Cardano is a diamond in the rough (in my personal opinion). There are plenty of other projects with much higher market capitalizations and attractive price action, but they are built on sand and driven by smoke and mirrors.
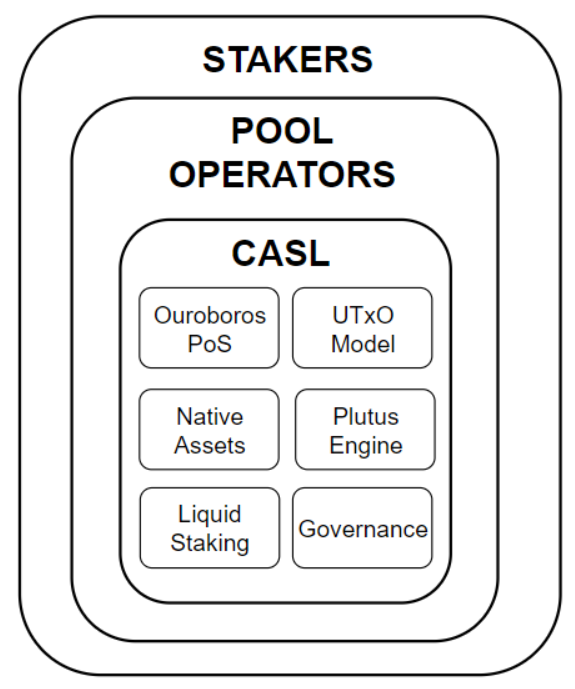
The Cardano Assets and Settlement Layer (CASL) is where the value of Cardano is derived from. Ouroboros: A Provably Secure Proof-of-Stake Blockchain Protocol is the most cited paper in the industry, with 692 citations currently. Which was used to develop Polkadot’s consensus algorithm BABE. The extended unspent transaction output accounting model used by Cardano is built upon the wonderful work of Satoshi Nakamoto’s UTXO model but extended to allow the support of multi-assets and smart contracts. But perhaps the most revolutionizing feature of Cardano is the beauty and simplicity of the liquid staking. Not any other layer-1 blockchain has come even near the level of technological marvel that Cardano has with native decentralized liquid staking.
But it’s not all sunshine and rainbows. I have been very critical with the path that Cardano has taken with implementing decentralized governance on-chain, specifically with CIP-1694. I have written about these topics in previous articles such as Why Governance on Cardano Will Fail, CIP-1694 “Temperature Check”: Vox Populi, Vox Dei? And Edinburgh Decentralization Index. Which shows that instead of a decentralized liquid democracy we are going to get a centralized plutocracy. But I’m open to being proven wrong.
Conclusion
I hope this article helps the people that don’t have a finance or economics background and may not be aware of the ramifications that macroeconomics has on cryptocurrencies such as Cardano. I’m not a Cardano maximalist, I’m very critical of the path that governance has taken and that’s a major question mark for me. But the value of the technology stack cannot be ignored and as a value investor, I personally look for projects with huge upside rooted in real value and not just hype or empty promises. Investing is not supposed to be fun, it’s a patience game that requires discipline and diligence. So keep building and wait for the FED to start printing money again BRRRRRR.